Domistock Tools Used: Dual Dominant Hedging Signal System, Fast Dominant Hedging Signal System, Trading Strategies - Tools Exploration, Inflated/Deflated Alert, DomiStock’s Technical Rating System
In my previous post I demonstrated one money making trading technique I use with both daily and intraday charts. It is one of DomiStock’s automated strategies (there is an exploration that scans for plenty different techniques and informs the trader which one is the best at any given time) and its called the ““Long the deflated winner” strategy.
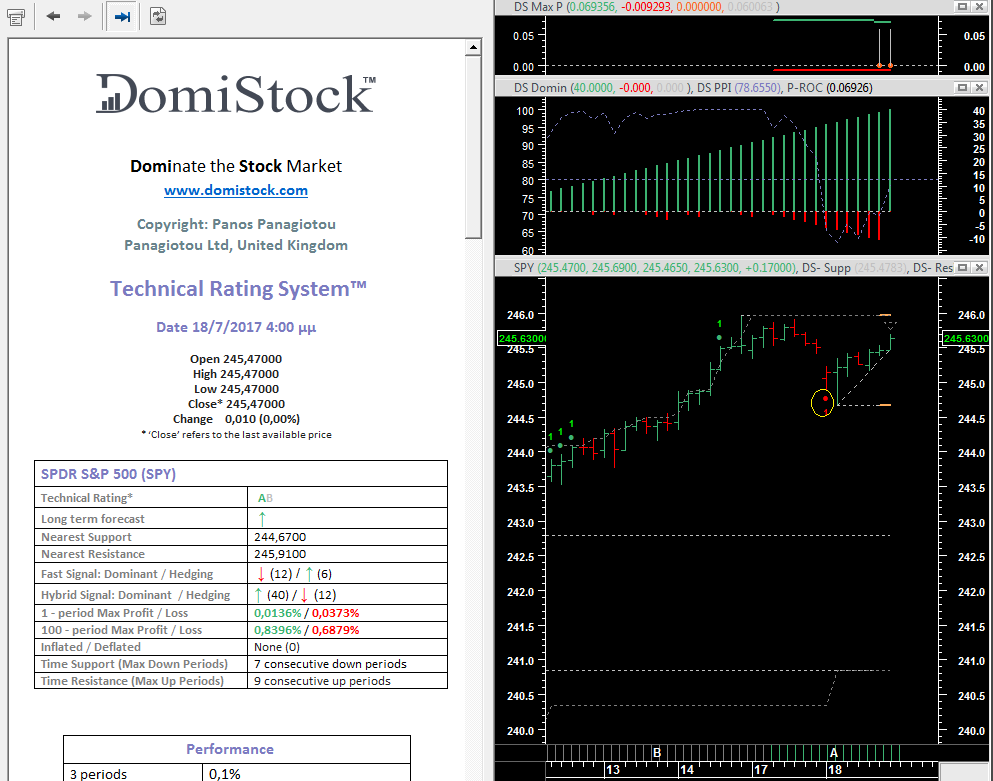
It involves an A rated security (A= winner security) that becomes deflated (It may or may not have a dominant or hedging up signal – this means that DomiStock spots incoming buying orders, either dominant or hedging ones – ). SPY was a candidate for this strategy today and that was the message on my previous post “Live: Intraday profit from DomiStock’s “Long the deflated winner” strategy’.
And it worked like a charm. On the circle is the price deflation alert DomiStock produced while SPY was still falling. That alert came as SPY had a confirmed A intraday rating (AB). From that point and on SPY moved higher. So why does this work? Who bought at that specific hour DomiStock marked SPY as deflated?
It all comes down to how the modern market ecosystem operates where more than 90% of trading is algorithmic. If you check the daily technical rating of SPY you will see that its a solid AA.
That is a quantitative rating similar to those the leading global funds use. When a trading algorithm of an investment fund’s portfolio optimizer sees that a security has an A rating but that has also become deflated when measured with historical data, it starts closing its short hedging positions and canceling any outstanding ones and that creates the dynamics for a bottom. When it turns on its buy mode and starts adding to its current position a new short term upward dominant trend gets in the making.
DomiStock’s innovative tools monitor that in real time and inform the trader with on chart and off chart tools.
And then it moves on to automatically plot the new support and resistance levels, the trendlines and much more.

